Electron Transition Peaks
Below is a spectrum measured from a hydrogen tube at McCormick Observatory. The single peak shown is the Hydrogen-alpha line.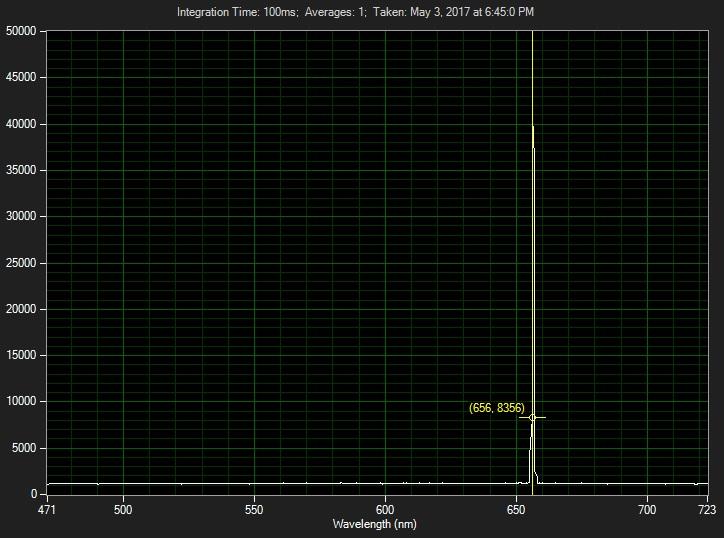
That single H-alpha peak is actually composed of unresolved peaks. The main peak represents a particular electron state transition. Here's the technical history. For a theoretical history try the first chapter in the book, Atomic Structure by Condon and Odabasi. For a hydrogen transition from the third to second energy state the Rydberg formula should be: 1/λ = R * Z (1/n12 - 1/n22) where n2>n1, Z=1, R=1.097373E7m-1, n1=2, n2=3, λ = 6.5611237E-7 m This is the H-alpha peak in the Balmer series (AKA Balmer-alpha). The value measured above (656.8356nm) is slightly different for numerous possible reasons such as measuring the hydrogen tube behind glass in a wooden display cabinet in the Summer ... Rydberg's formula expresses the difference (shift) between wavenumbers (energy between electron states). The Rydberg constant itself is a wavenumber: R=1.097373E7 m-1. The associated wavelength (91.1267181 nm) apparently represents the extreme ultraviolet energy of a photon given off by an electron that fell from infinity to the 1st energy level (n2=1, n2=infinity). Such a thing is probably only possible in a laboratory or in outer space. The Raman wavenumber shift also measures an energy difference:
 The energy difference of a Raman shift represents the difference between an
exciting photon's initial energy and the same photon's energy after
inelastic scattering by a vibrational mode of a moleculer structure.
The energy difference of a Raman shift represents the difference between an
exciting photon's initial energy and the same photon's energy after
inelastic scattering by a vibrational mode of a moleculer structure.
Labeling Raman Peaks
As far as I know, there is no simple formula for calculating Raman peak positions as was done with the Rydberg formula. Typically some software is used to simulate spectra using DFT "density functional analysis" (using a hybrid functional and specific basis). In further analysis the molecular geometry is manually/visually inspected for symmetry elements,... something gets normalized, and stability is checked with NBO "Natural Bond Orbital" analysis, then PED "Potential Energy Distribution" analysis is used to assign vibrational modes to the spectral wavenumbers; followed perhaps by further analysis to determine other molecular properties. Other ab initio methods: * Sequential: solve the electronic part of the Schrödinger equation in the Born–Oppenheimer approximation, mapping out the potential energy, dipole moment vector (for infrared absorption) and polarizability tensor (for Raman scattering) as functions of nuclear coordinates then solves the nuclear part of the problem either classically or quantum mechanically. * Simultaneous: liquids, clusters, or floppy molecules: quantum force classical trajectory (QFCT) molecular dynamic method, based on linear response theory. The forces, dipole moment, and polarizability are computed quantum mechanically, using gradient techniques step by step along a classical trajectory whose path is determined by these quantum forces * Parallel: For parameters not depending on momenta. A Monte Carlo approach would use electronic energies and other parameters of interest generated quantum mechanically, and ‘‘classical’’ trial moves of the nuclei. See the reference for ABINIT. Example of Raman Mode Analysis (.pdf) from RRUFF. In general (AFAIK): The less-shifted peaks represent heavier molecules while the more shifted peaks represent scattering by lighter molecules. A Raman peak should represent a specific molecular vibration state if: 0 > polarization ratio < 6/7 Below is a test of labeling specific spectral peaks (the sensitivity of peak detection can be lowered to label only significant peaks). But the specimen used was "inorganic" (crocoite). These bands were listed by Horiba et al. They are "organic" vibrational band assignments and have limited application for minerals. I don't know of any corresponding list for "inorganic" Raman bands.