In a Nutshell
A laser strikes a sample and most of its light is reflected without being changed. That unchanged light is filtered out as much as possible. The small amount of light that has been changed and reflected by the sample contains information about the sample. That small amount of changed light is sent into a spectrograph which does the same thing that a prism does. But instead of a big colorful rainbow, a smaller range of wavelengths are seen that are relatively close to the laser's own wavelength. (which is why the unchanged laser light has to be filtered out so that we are not blinded by it. It is similar to what astronomers do to see distant planets orbiting around bright stars. Astronomers block out the bright starlight in order to see the faint light reflected off the distant planets.) The spectrograph produces a spectrum which shows discrete peaks. That is the Raman spectrum and deciphering it reveals a lot of information about the sample.Overview
The parts of a Horiba Aramis Labram Raman microscope were being sold piecemeal locally by a industrial salvage dealer at reasonable prices. Unfortunately we did not obtain the original detector, and some of the optics, but most of the essentials were there. So we decided to try and rebuild it. At that time (2016?), Raman spectrographs were big, expensive, and apparently high-maintenance. Nowadays (2025) they are small, way more powerful, and ubiqitous. And Raman spectra databases are growing in number. The columns above are roughly ordered by progress over time, the maintenance became too time consuming, and many problems remain unresolved. And we never got around to exploring many ideas like using a PEM to modulate laser polarization or looking for interesting effects like soft modes in quartz alpha-beta transitions (don't we need an oven for that?)
General
Raman Spectroscopy deals with molecular-scale properties. It reveals information about both chemistry and structure. It has a sort of blindspot: it provides information that is complementary to that of IR spectroscopy. It is a really fun area to study. Not quite as complicated as sub-atomic and sub-nuclear. But complex enough to require deep thinking.Theoretically
The Raman spectra can be 'ab initio' synthesized in terms of Density Functional Theory (to some extent?). A group theoretic analysis of known molecular symmetries can be used to derive the selection rules that determine whether or not an expected peak will be physically detectable ("not forbidden") for a given method of observation.Physically
The Raman spectrograph detects certain excitable modes (thermal lattice vibrations etc); the inelastic (energy exchanging) deformations of molecular structures. The induced excitations allows the Raman Effect to be used for "Raman Cooling" in the case of anti-Stokes scattering. The Raman effect is also used as a gain medium in Raman Lasers of arbitrary wavelengths which is very interesting. Also, the ability to measure the rotational spectra of gases looks treatable mathematically identically to that of double sideband suppressed carrier frequency modulated spectra where the (small, gaseous) molecules are spinning around like tiny satellites in space. Supposedly you can get such rotational spectra from non-gaseous materials like camphor.Technology
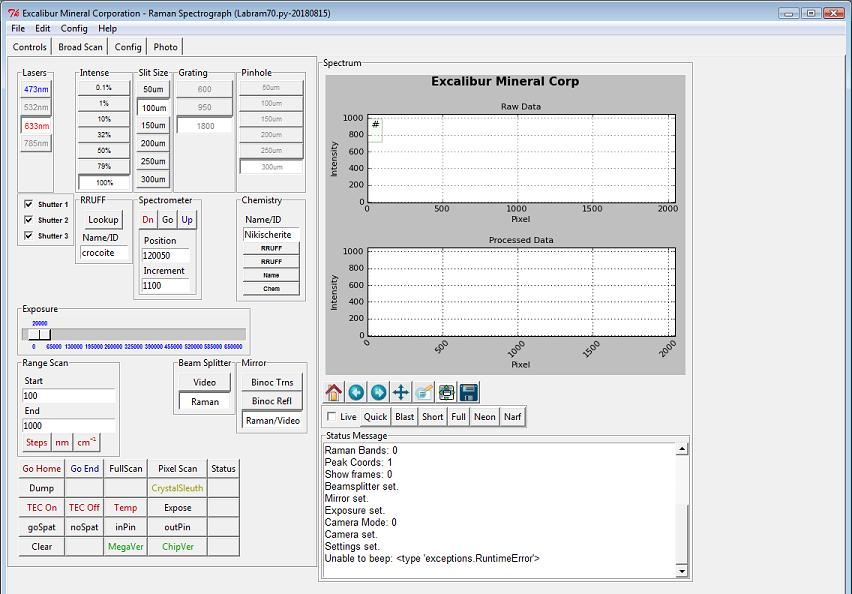
The Horiba Aramis Labram Raman microscope uses holographic notch filters to remove the Rayleigh (elastic) scattered light from the beam before it reaches the spectrograph. This type of notch filter (as opposed to dilectric types) have certain benefits, but they seem to be constructed from a photographic gel which can degenerate over time requiring angular adjustment of the filter. Some Raman filters are also designed to simultaneously act as beamsplitters, AKA "injection/rejection" filters which can become very difficult to align. A more discrete solution is to use a separate dichroic beamsplitter with some loss of sensitivity. More recent spectrographs seem to be using transmission gratings. Recent spectrographs also seem to have better performance below 100/cm. More recent developements show considerable progress which marks the start of a golden age for photonics and its use for materials analysis. Polarization is big deal in Raman spectroscopy. If the exciting laser is linear polarized it will have a strong effect on certain specimen directions a weaker effect on the others. For this reason circular polarizers, PEMs, or non-polarized lasers can be used to give an average Raman response for a single specimen orientation. Or the specimen can be mounted on a rotating stage. Or the specimen can be powdered into averaged orientations (as in powder x-ray diffraction for the same reason). But a linear polarized exciting laser gives valuable structural information when the specimen is in a well-known orientation. The ratio of intensities for different polarization is an important figure (Raman Tensor). Polarization can be difficult to control in the optical beam path to the specimen, and I suspect its path to the detector may be important as well.User Interface
The Raman spectra peaks represent vibrational mode energy transitions. The vibrational modes are associated with atomic bonds in the molecules. The peaks on the high-shift end of the Stokes side represent modes in the bonds of lighter elements because those peaks have longer wavelengths (higher wavenumber shifts) and represent lower (red-shifted) Raman scattered photon energies meaning the exciting laser's photons have lost a lot of energy to the specimen (because the lighter elements have less inertia). Pfew! The peaks closer to the laser line on the Stokes side represent the modes of bonds between heavier atoms. Generally the anti-Stokes lines are supposed to be symmetric with the Stokes side- but their transitions are less favorable because the anti-Stokes transitions involve removing heat from the specimens and efficient cooling is contrary to the second law of thermodynamics. The peak positions are generally characteristic of chemical and structural properties. But an individual peak can move around in a still background of the other peaks if the molecular structure of a specimen is stressed in a particular bond-dependent direction. In the context of Raman spectroscopy, 'temperature' becomes a more interesting topic in terms of thermal phonons when treated as quasi-particles that carry momentum as quantized sound waves.
Partial Specs: Horiba LabRAM Aramis (modified by our rebuild) CCD Hamamatsu C7041 single stage TEC head with S7031-1006S back-thinned FFT-CCD sensor with AR coated sapphire window (beware of Cr fluorescence). Pixels: 1044x64. Active pixels: 1024x58. Pixel size 24x24um. Spectral range 200-1100nm. Gratings 600, 950, 1800 Microscope: Olympus BX41 Objectives U-P4RE turret Olympus epi-illumination alignment objective Olympus 10x CY PLAN N (filter removed) NA0.25 inf/- Olympus 40x PLAN inf/0.17 NA 0.65 Olympus 50x UIS2 MPLAN inf/- NA 0.75 Olympus 100x UIS2 MPLAN inf/- NA 0.9 stage U-SP fixed stage binoc head U-BI30 WF10X eyepieces turrets: U-P4RE with objective centering U-D5DREMEC motorized turret condensor fiber optic illumination (Russian-made fiber light source) 632.8nm 20mW TEM00 LP HeNe Meredith Instruments Laser: beam diameter: 0.80mm divergence: 1mRad head: 660x44.5mm (h*c/633nm)*(6.242E+18)=1.95929515 eV/photon 473nm "10W" blue diode laser: B&W BWB-10-OEM ; not currently used 532nm 200mW Melles-Griot green diode laser. PC Dell running Win XP Python 2.7 (3.x ready?) numpy scipy mathplotlib PIL pyserial others Arduino IDE Chipkit Libraries MCUs Arduino Mega32 Digilent Chipkit uc32 (alt. Max32 for full frame transfers) Adafruit Motor Shields v2.3 ADCs Mayhew 16-bit extended ADC shields
| "We note that the basic unit of temperature, the kelvin, is equivalent to about 0.7 cm-1, i.e., the value of the Boltzmann constant k expressed in wavenumber units per kelvin is 0.695 035 6(12) cm-1/K. One reason for citing this particular equivalency involving the internationally accepted symbol for the kelvin (K) [1] is to suggest that use of the letter K as a symbol for 1 cm-1 (1 kayser) should be discontinued." |
DIY Raman projects:
jm-derochette.be - Raman Microscopy for the Amateur Mineralogist
adolph cortel - Use a piece of cardboard as a Raman filter
Charles LeLosq's RamPy (geoscience source code)
Arbildo Lopez Aurelio
erossel - DIY Raman spectroscopy
radagast - Lego Raman
flatcat- RamanPi
Technologia Incognita
Hanson and Vargis
Physics Open Lab
Videos:
Horiba Operation - South Dakota State University
Renishaw Operation - MDITR
Tips for Laser Alignment - CO2 cutter/engraver

The Pacman sound made by the extended range scanning stepper motor.
Disclaimer: The information on this webpage is provided for educational purposes only
and no claims are made of accuracy, or suitability for any particular use by the reader.
Excalibur Mineral Corp 2015-2025